


Abstract
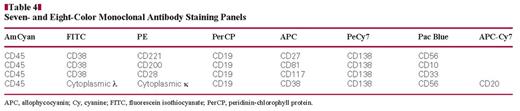
We have developed a new statistical diagnostic model that examines the correlation between immunophenotype and clonality as detected by flow cytometry (FC) and histology, defining the diagnostic role of FC in multiple myeloma (MM). The 192 bone marrow samples from patients and control subjects were studied for routine diagnostic analysis of MM; a minimum of 100 plasma cells (PCs) were analyzed for each patient sample. A direct 7- or 8-color method was applied to study the immunophenotype of PCs, utilizing a FACSCanto II (BD Biosciences, San Jose, CA). Samples were labeled with fluorochrome-conjugated monoclonal antibodies (AmCyan, Pac Blue, fluorescein isothiocyanate, phycoerythrin [PE], PECy7, peridinin-chlorophyll protein, allophycocyanin [APC], and APC-Cy7) to the following antigens: CD138, CD81, CD200, CD221, CD45, CD38, CD28, CD19, CD27, CD117, CD38, CD33, CD20, CD56, CD10, and immunoglobulin κ and λ light chains. Among all antigens tested, CD19 and CD27, when applied to our model, resulted in optimal concordance with histology. This model defines the effective diagnostic role FC could have in MM and in the detection of minimal residual disease.
Multiple myeloma (MM) is a clonal B-cell disorder in which malignant plasma cells (PCs) accumulate in the bone marrow, producing lytic lesions, excessive amounts of monoclonal protein in the serum or urine, and evidence of end-organ damage (hypercalcemia, renal insufficiency, anemia, or bone lesions). A conventional diagnosis in MM is based on a variety of laboratory results: morphologic features, analysis of M component, hematologic features, biochemical parameters, immunophenotyping, cytogenetics, DNA ploidy, and labeling index–proliferative activity of PCs. These laboratory investigations have 3 main goals: (1) to contribute to the diagnosis and differential diagnosis of monoclonal gammopathies, (2) to give information about prognostic factors in order to initiate the most appropriate treatment, and (3) to monitor treatment efficacy.1
Immunophenotypic studies on MM have been performed for more than 15 years, and flow cytometry (FC) represents an attractive approach, not only for research purposes but also for guiding clinical practice. In this sense, FC has many advantages: (1) distinguishing among normal, reactive, and malignant PCs2–6; (2) evaluating the risk of progression from monoclonal gammopathy of unknown significance (MGUS) to MM7–9; (3) detecting prognostic markers5,10–18; (4) evaluating minimal residual disease (MRD)2,19–22; and (5) identifying new targets for myeloma therapy.5,13,23–39 However, a careful review of the literature shows discrepancies in results regarding the exact immunophenotype of normal and abnormal PCs and their associated clinical significance. These controversies could be due to methodological problems, such as different gating strategies, the use of different monoclonal antibody clones or different fluorochromes, and the use of single vs multiparametric antigen staining procedures. Furthermore, it is important to consider additionally that FC may be problematic in obtaining quantitative information in evaluating PCs in bone marrow because of the frequent physical loss of these cells and/or hemodilution with peripheral blood.
It may be difficult to define the clonality of a very small phenotypically abnormal PC population in MRD by histology and FC. At this time, histology remains the “gold standard” examination, but we herein define a new diagnostic model that is objective and reproducible for describing the correlation between phenotype and histology. Based on our experience, we found 8-color FC analysis to be a superior technique for identifying pathologic PCs, especially in MRD. In a previous study, we found that CD19 showed good correlation with the presence of disease using a cutoff of 61% to distinguish between normal and neoplastic PCs.40 However, the previous study evaluated the role of each antigen separately in detecting the presence of disease. In the present study, we assumed that the contribution of different antigens assessed simultaneously would improve the correlation with histologic results. We describe a statistical model in which among all antigens tested, assessing CD19 and CD27 together resulted in optimal concordance with histology. This model defines the effective diagnostic role FC could have in MM and in the detection of MRD.
Diagnosis, Time, and Response to Chemotherapy in 105 Cases Used to Define and Test the Statistical Model*
Diagnosis, Time, and Response to Chemotherapy in 105 Cases Used to Define and Test the Statistical Model*
Diagnosis, Time, and Response to Chemotherapy in 72 Cases Used to Test the Statistical Model Prospectively*
Diagnosis, Time, and Response to Chemotherapy in 72 Cases Used to Test the Statistical Model Prospectively*
Materials and Methods
Control and Patient Samples
All specimens for this study were obtained from Massachusetts General Hospital (MGH; Boston) or Santa Chiara Hospital (SCH; Pisa, Italy). Control specimens consisted of 15 bone marrow samples obtained from patients seen by the orthopedic service of MGH for elective hip replacement. These patients had no history of PC myeloma, MGUS, or other hematologic diseases. The PCs identified in all of these samples were polyclonal and were CD19+/CD56–. Bone marrow samples from 177 patients suspected or known to have PC neoplasms submitted to MGH and SCH laboratories for routine analysis from April 2008 to April 2010 were evaluated by FC and histologic and immunohistochemical studies. We evaluated cases with a new diagnosis of MGUS or MM and cases that represented patients in evaluation after chemotherapy or after autologous or allogeneic stem cell transplantation. The 15 control specimens and 105 of the 177 patient specimens were used to define the statistical model and, after obtaining bone marrow histologic results, to test the applicability of the model retrospectively Table 1. The remaining 72 patient samples were then used to test the statistical model prospectively (before obtaining bone marrow histologic results) Table 2. Response to therapy was defined according to Durie et al41Table 3. The study was approved by the institutional review board of Partners Healthcare, Boston, and SCH.
Flow Cytometry
Bone marrow aspirate specimens were tested on a 3-laser FACSCanto II (BD Biosciences, San Jose, CA) using DiVa 6.1.1 software; instrument calibration was performed and tested weekly. Weekly calibration using CS&T beads (BD Biosciences) was performed, as was compensation using appropriately stained normal peripheral blood samples, as previously described.40,42 Whole bone marrow and hip marrow samples collected in EDTA anticoagulant were washed 3 times in phosphate-buffered saline (PBS) and resuspended with 1% bovine serum albumin in PBS. The 100 μL of washed cells were incubated with each of the following titered monoclonal antibodies and corresponding volumes for 15 minutes at room temperature in the dark: 7 μL CD138-PeCy7 and 5 μL CD81-allophycocyanin (APC; BD Biosciences); 3 μL CD200-phycoerythrin (PE) and 3 μL CD221-PE (BD Pharmingen); 3 μL CD45 AmCyan, 8 μL CD38-fluorescein isothiocyanate (FITC), 3 μL CD28-PE, 8 μL CD19-peridinin-chlorophyll protein (PerCP), 5 μL CD27-APC, 5 μL CD117-APC, 5 μL CD38-APC, 7 μL CD33-Pac Blue, 7 μL CD20-APC-Cy7, 7 μL CD56-Pac Blue, and 7 μL CD10-Pac Blue (BD Biosciences); and 10 μL of each immunoglobulin κ and λ light chain (DAKO, Carpinteria, CA) PE and FITC, respectively. These markers were identified among many other possible choices because they are cited frequently for use in detecting PCs and for distinguishing between normal and abnormal PCs.2,38,39 The antibodies were combined as shown in Table 4. Erythrocytes were lysed by incubating with 2 mL of 1:10 diluted BD FACS lysing solution for 10 minutes (10 mL of BD FACS lysing solution in 90 mL of deionized water). After incubation, cells were pelleted by centrifugation (416g for 5 minutes at room temperature), the supernatant was aspirated, and the cells washed once in PBS. After the final wash step, cells were resuspended in 0.5 mL of 1% of paraformaldehyde in PBS.
International Myeloma Working Group Uniform Response Criteria for Multiple Myeloma41
International Myeloma Working Group Uniform Response Criteria for Multiple Myeloma41
To detect cytoplasmic κ and λ light chain expression, the Fix and Perm (Caltag, Burlingame, CA) cytoplasmic staining kit was used as follows: After incubating the specimen with anti–surface antibodies for 15 minutes, the sample was washed with 1× PBS and added to 100 μL of Fix and Perm reagent A solution. After 15 minutes of incubation, the cells were washed again and added to 100 μL of Fix and Perm reagent B solution together with anti-κ and anti-λ light chain antibodies and incubated for 15 minutes. The supernatant was discarded, and cells were resuspended into 0.5 mL of PBS.
To obtain a minimum of 100 PCs in the analyzed region, the number of total bone marrow cells acquired for each sample tube ranged from 160,000 to 1,000,000.2,40 To detect MRD at 0.01%, the minimum number of total collected events required was approximately 106. To optimally detect PCs, we analyzed a combination of CD138, CD38, and CD45 together with light scatter, as previously described.2,40 Briefly, an initial immunofluorescence analysis gate was devised using CD38 vs CD138 expression, a second one using CD38 brightly positive vs CD45+ and CD45– cells, and the last one using light scatter characteristics (high forward scatter and low side scatter). These 3 intersecting gates were used to obtain a defined PC population in multidimensional space. Commingling gated lymphocytes served as internal controls in patient and control specimens for studying the associated PC population; thus, the expression of antigens detected on PCs was compared directly with that of autologous gated lymphocytes in the patient and control specimens. The expression of all 17 antigens detected on PCs was then analyzed by a logistic regression statistic to estimate the probability that the event termed “presence of disease” occurred, in comparison with histology.
Histologic and Immunohistochemical Examination
Tissue examination of patient samples was performed to determine the presence of monoclonal or polyclonal PCs and disease status. For the examination, 2-μm-thick B+-fixed, paraffin-embedded bone marrow core biopsy sections were prepared, deparaffinized, and rehydrated according to standard laboratory protocols. A combination of EDTA and boric acid in tris(hydroxymethyl)aminomethane buffer (CC1 reagent, Ventana Medical Systems, Tucson, AZ) was used for antigen retrieval before primary antibody incubation. Immunohistochemical studies for CD138 (1:30 dilution; Serotec, Raleigh, NC) was performed using avidin-biotin peroxidase complex with a peroxidase-labeled detection system on a BenchMark XT automated immunostainer (Ventana) using validated staining protocols. In situ hybridization for κ and λ immunoglobulin light chains was performed using the HX Automatic System BenchMark (Ventana) according to the manufacturer's instructions. Signals were detected using the Alkaline Phosphatase Enhanced Detection Kit (Ventana).
Histology defined the presence or absence of disease on the basis of determining PC clonality. Cases with PC neoplasms were confirmed to have a clonal PC population as determined by one of the following: (1) more than 10% morphologically abnormal PCs on the bone marrow aspirate and fulfilling World Health Organization criteria for a diagnosis of PC myeloma, or (2) a monotypic κ+ or λ+ PC population identified in the bone marrow biopsy sample by CD138 immunohistochemical studies and in situ hybridization for κ and λ light chains.
Statistical Analysis
A logistic regression statistic was used to estimate the probability that the event termed presence of disease occurred. An independent variable (antigen) was defined as statistically significant when the P value of its corresponding coefficient was .05 or less by the likelihood ratio test. To determine whether the logistic regression model fit, the χ2 goodness-of-fit test was used, and the model was accepted for a P value of .05 or more. The logistic regression analysis was performed by a stepwise method, by which all variables are initially tested after which only the variables found to be statistically correlated were included in the model. Analyses were performed with the software STATGRAPHICS XV (StatPoint Technologies, Warrenton, VA).
Results
Of the 17 unique antigens tested in this study, CD19 (P = .0000) and CD27 (P = .0001) were found to be statistically correlated with histologic results distinguishing between the absence or presence of disease and, thus, deemed eligible to be included in the model. Table 5 shows each of the antigen model values obtained for the coefficient, P value, standard error, odds ratio, and 95% confidence intervals.
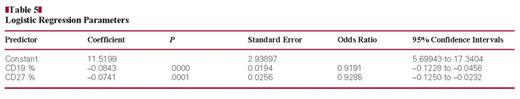
The sign of the coefficient indicates the direction of the S curve (the curve of the logistic regression equation) and of the probability. If the coefficient is positive, the S curve and the probability that the event occurs increase; likewise, if the coefficient is negative, the S curve and probability that the event occurs decrease.
Table 5 shows that CD19 and CD27 have negative coefficients, which indicates that if the values of CD19 and CD27 are high, the probability that the event presence of disease occurs, is low. These findings are in accord with existing literature.2,39,43,44
The probability P that the event presence of disease occurs ranges between 0 and 1, where 0 means that the event does not occur (absence of disease), and 1 means that the event occurs (presence of disease). This model makes predictions about the probability that the event presence of disease will happen for each patient, given the values of the variables CD19 and CD27 Figure 1. The value obtained via the model ranging between 0 and 1 was compared with what was observed by histologic results (0 or 1). Histology defined the presence or absence of disease on the basis of determining PC clonality and is the gold standard for detecting the presence of disease in MM. The χ2 goodness-of-fit test was used to determine whether this logistic regression model fit; the test measures the overall difference between what it was expected to see via the model vs what was observed by histologic results. With a P value of 0.520998, this model can be accepted by this test (P ≥.05). The percentage of variability that is explained by the model (R2) is 74%. The adjusted R2 is 70%; considering that an adjusted R2 equal to 70% is considered high, we were able to accept our model.
Table 6 shows the way of interpreting values ranging between 0 and 1, obtained by the model. The difference between the value of the event observed by histology and value of the event predicted by the model was used to calculate their concordance. Table 7 shows that for a difference value of 0 to 0.2, it was assumed there is concordance; for a difference value of 0.21 to 0.5, there was doubtful concordance; and for a difference value of more than 0.5, there was no concordance. Of the 120 cases used to find the statistical model, the percentage of concordant cases was 85.0%, of doubtful cases was 9.2%, and of discordant cases was 5.8%. The statistical model was then tested prospectively on another 72 patient samples, and the percentage of concordant cases was 92% (66/72) and of discordant cases was 8% (6/72).
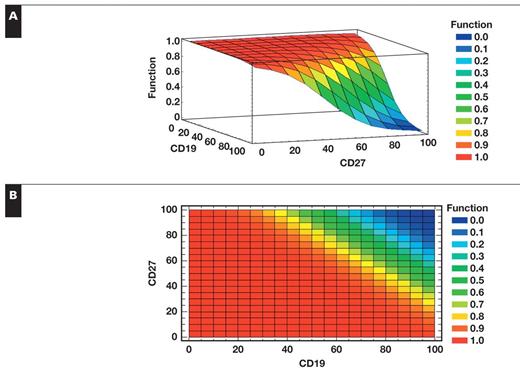
Probability 3D (A) and 2D (B) models. If the values of CD19 and CD27 are high, the probability for the presence of disease is high and vice versa.
Modality of Interpreting Values Ranging Between 0 and 1 Obtained by the Model
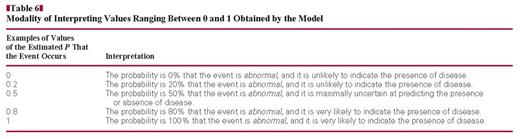
Modality of Interpreting Values Ranging Between 0 and 1 Obtained by the Model
Difference Between the Value of the Event Observed by Histology and Value of the Event Predicted by the Model in 120 Cases*
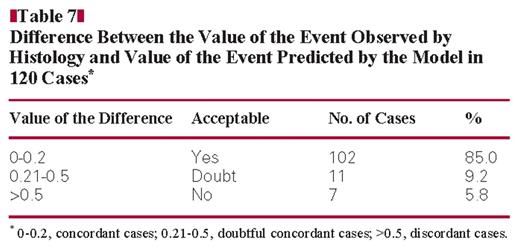
Difference Between the Value of the Event Observed by Histology and Value of the Event Predicted by the Model in 120 Cases*
Table 8 and Figure 2 show the data for cases in which patients received therapy, from the 120 cases used to determine the statistical model. The cases are divided by response to therapy and concordance of results between histology and the statistical model. Of 23 patients with complete response, 16 were shown to be without disease by histology and the statistical model (H/M = 0/0), 2 without disease by histology and with disease by the model (H/M = 0/1), and 5 without disease by histology and with uncertain results by the model. Of 12 patients with a partial response, 10 had disease shown by histology and the model (H/M = 1/1) and 2 had disease by histology but not by the model (H/M = 1/0). Of 16 patients with stable disease, 15 had disease shown by histology and the model (H/M = 1/1) and 1 had disease by histology and uncertain results by the model. Of the 11 patients with progressive disease, 10 had disease shown by histology and the model (H/M = 1/1) and 1 had disease by histology but not by the model.
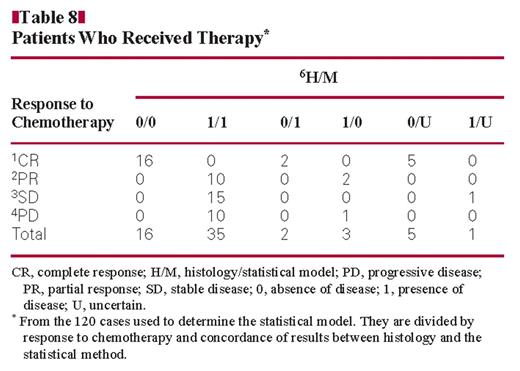
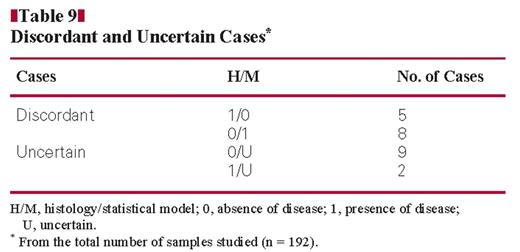
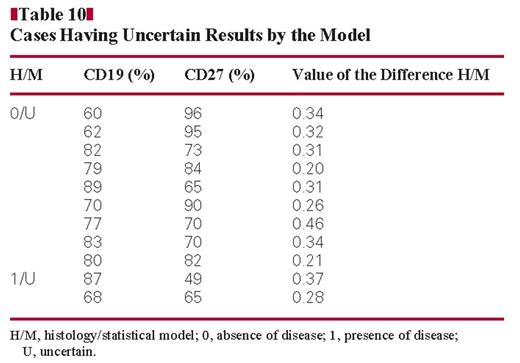
Table 9 shows the number of discordant and uncertain cases from the total number of samples studied (n = 192). Cases 1/0 were CD19 and CD27 positive myeloma cases. Cases 0/1 were the cases in which a monoclonal PC population was detected together with a polyclonal PC population by flow cytometry. In these cases, our model is more accurate than histology. Table 10 shows cases having uncertain results by the model. These cases have a difference between the value of the event observed by histology and the value of the event predicted by the model ranging between 0.20 and 0.46 Figure 3. These cases have a CD27 expression ranging between 49% and 96% and CD19 expression between 60% and 89% Figure 4.
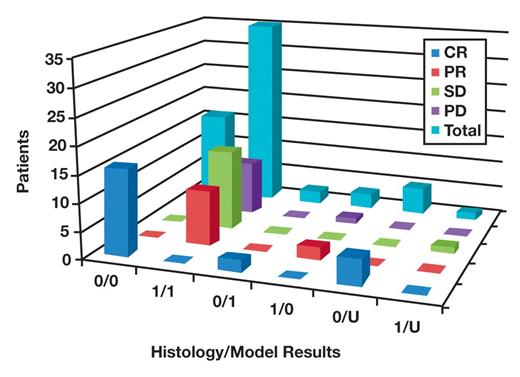
Cases given therapy from the 120 cases used to determine the statistical model. The cases are divided by response to therapy and concordance of results between histology and the statistical model. CR, complete response; PD, progressive disease; PR, partial response; SD, stable disease; 0, absence of disease; 1, presence of disease; U, uncertain.
Discussion
The role of FC is important in detecting MRD in myeloma when there are fewer than 5% of PCs by morphologic examination and a very small percentage of PCs to detect clonality by histologic examination. Unlike morphologic and histologic studies, FC is not dependable for providing quantitative information about MM, but provides qualitative information for assessing the immunophenotype and light chain clonality of PCs. The percentage of MRD detection by FC (97%) is comparable to that obtained by histology (96%) and better than obtained by conventional molecular analysis (60%–70%) and in situ hybridization (50%). Immunofixation electrophoresis is not informative about response until 6 months after the end of therapy owing to the time required for the M component to disappear.22 No single antigen has been reported to systematically differentiate abnormal PCs from their normal counterparts, and it is not possible to distinguish between normal and abnormal PCs on the basis of CD19 and/or CD56 alone owing to the presence of clonal CD19+ and/or CD56– PCs and polyclonal CD19– and/or CD56+ PCs.2,13,45
It is important to detect clonality and immunophenotype together, especially when attempting to detect MRD. In that situation, it is difficult to evaluate the κ/λ ratio because the restriction for one light chain is evident when the clonal population represents at least 30% of the polyclonal background. For this reason, some investigators look for the cytoplasmic heavy chain during follow-up after therapy.2 It has been reported that MRD detection is clearly associated with the total PC percentage and that for a low percentage of PCs, it is not possible to accurately distinguish between truly MRD-negative cases and very low levels of residual disease.45
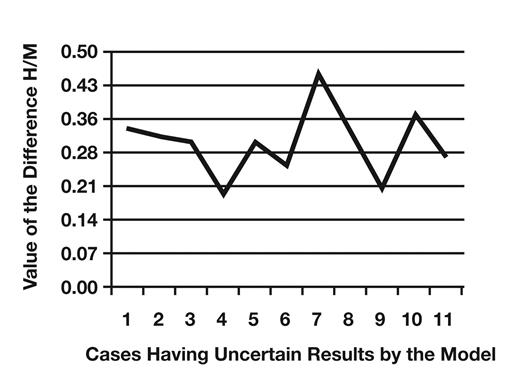
Value of the difference H/M in cases having uncertain results by the model. H/M, histology/statistical model.
CD19, CD56, cytoplasmic κ, and cytoplasmic λ are known to be the antigens most involved in distinguishing between normal and abnormal PCs, but in this investigation, testing many different antigens together, it was indicated which of them was significantly correlated with histologic results (and with the presence or absence of disease) through a logistic regression test. In this report, we describe a new diagnostic statistical model, which is objective and reproducible, to observe the correlation between immunophenotype and histology. This model defines the effective diagnostic role FC could have in MM and, above all, in detecting MRD. With an adjusted R2 of 70%, we showed a correlation exists between FC analysis and histologic results.
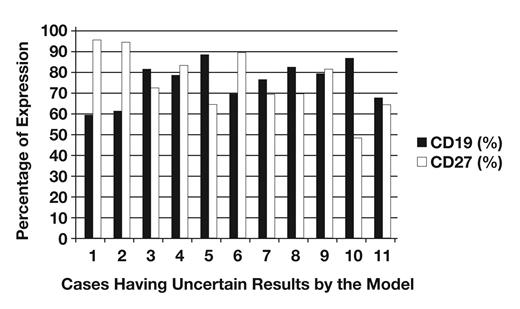
Percentage of CD19 and CD27 expression in cases having uncertain results by the model.
Among all antigens tested, CD19 (P = .0000) and CD27 (P = .0001) were found to be statistically correlated with histologic results and useful in distinguishing between the absence and presence of disease and, thus, eligible to be included in the model. This model makes predictions about the probability that the event presence of disease will occur for each patient, given the values of the variables CD19 and CD27. It is interesting that expression of cytoplasmic κ, cytoplasmic λ, and CD56 was not correlated with histologic results. CD56 expression was reported in 70% to 80% of MM cases,46,47 but also on polytypic PCs in healthy donors.48 In a previous study, we found that the range of normal expression obtained for CD56 is relatively wide (0%–47%), and CD27 had a role similar to that of CD56 in detecting the presence of disease.40
As described, it is not always possible to evaluate the κ/λ ratio in MRD when there is a low percentage of PCs; the statistical model found in this study seems to overcome this problem by using the values associated with CD19 and CD27. CD19 is an antigen gained in early stage of B differentiation and always present in the majority of normal PCs. On the other hand, only a small percentage (<5%) of patients with MM express this antigen.13 Mateo et al13 showed that patients with MM with CD19+ cells have a less favorable outcome than patients lacking CD19 expression, with a progression-free survival and an overall survival approximately 1 or 2 years shorter. CD27 is expressed on B-cell subsets and on the majority of peripheral T cells.39,49 It has been reported that the expression of CD27 on the PCs of patients with MGUS is similar to that on normal PCs. The loss of CD27 in MGUS has been linked to MM progression. The lack of CD27 expression is usually coupled to the loss of CD19. Conversely, the loss of CD19 is not always associated with that of CD27 in monoclonal gammopathies.43 Gene expression profile studies also reveal that CD27 expression is reduced in myeloma cells compared with the elevated expression in normal PCs.44
From the 120 samples used to create our model and tested retrospectively, we obtained perfect concordance between our model and histology in 85.0% of cases (102/120) and an uncertain and a discordant result in 9.2% (11/120) and 5.8% (7/120) of cases, respectively. With the 72 samples tested prospectively, the percentage of concordant cases was 92% (66/72), with 8% discordant cases (6/72). Discordant cases were CD19+ and CD27+ myeloma cases (1/0 cases in Tables 8 and 9) and cases in which a monoclonal PC population was detected together with a polyclonal PC population by flow cytometry (0/1 cases in Tables 8 and 9). Cases having uncertain results by the model have a difference between the value of the event observed by histology and the value of the event predicted by the model ranging between 0.20 and 0.46 (Table 10 and Figure 4). These values are less than 0.50 and so could be considered acceptable, although, to make the model very restrictive, a value of difference between 0 and 0.20 was considered acceptable. Therefore, even if not perfect, this model is certainly acceptable and potentially might be improved by increasing the sample size.
In a previous study, we evaluated the role of each antigen separately in detecting the presence of disease.40 In this study, the contribution of different antigens evaluated together was analyzed, and we found that CD19 and CD27 were the antigens that correlated with the state of disease evaluated by histology. This model offers a fast way to detect the presence of disease by FC, which started with a small panel of antigens consisting of CD38, CD138, CD45, CD19, and CD27. We cannot exclude that more and/or different antigens could be involved in this correlation in other samples.
We also evaluated how the results obtained by the model are concordant with the actual classification of response to chemotherapy (Table 8). We observed that for 62 treated patients, 35 had positive results by histology or the model; 10 cases were classified as partial response, 15 as stable disease, and 10 as progressive disease. In 16 cases, results were negative on both, and all were classified as complete response. Discordant cases between histology and the model were CD19+ and CD27+ myeloma cases (three 1/0 cases in Table 8) and the cases in which a monoclonal PC population was detected together with a polyclonal PC population by FC (two 0/1 cases in Table 8). In these last cases, our model was shown to be more accurate than histology. We believe this model may be adopted as an additional method to evaluate disease response to chemotherapy, considering the limits of immunofixation and histology in detecting MRD.
Conclusions
In agreement with previously reported results, our diagnostic model confirmed the importance of the absence of CD19 expression in detecting the presence of MM. In contrast, CD56 seemed not to have a significant role. We also found that the absence of CD27 expression was an additional marker correlated with the presence of disease. By application of this model, we found an objective and reproducible way to assess the malignancy of PCs that was highly correlated with histologic results and permitted the reproducible detection of MRD. Its practical application is simple and rapid and does not require specialized technicians. We propose to use the formula reported in the “Results” section as a routine diagnostic tool. It may be applied with a simple electronic database or spreadsheet program in which input of CD19 and CD27 expression values for each patient studied returns a value for the probability of disease. The model plot (Figure 1) may also be used for a rapid test. A difference value of 0.2 (Table 7) could be used as the cutoff of concordance between histology and the statistical model.
This model was devised using samples collected in 2 laboratories. Our next goal will be to involve more laboratories in a multicenter study to improve the model’s forecasting efficiency.
We recognize and appreciate the technical expertise of Michelle Delelys.
Upon completion of this activity you will be able to:
outline the gating strategy to detect human plasma cells.
list the immunophenotypic markers useful in detection of plasma cell disease and describe how they can be used.
describe the normal expression of CD19 and CD27 on plasma cells.
describe an effective examination strategy to detect minimal residual disease in multiple myeloma.
The ASCP is accredited by the Accreditation Council for Continuing Medical Education to provide continuing medical education for physicians. The ASCP designates this journal-based CME activity for a maximum of 1 AMA PRA Category 1 Credit ™ per article. Physicians should claim only the credit commensurate with the extent of their participation in the activity. This activity qualifies as an American Board of Pathology Maintenance of Certification Part II Self-Assessment Module.
The authors of this article and the planning committee members and staff have no relevant financial relationships with commercial interests to disclose.
Questions appear on p 491. Exam is located at www.ascp.org/ajcpcme.
References
